Integrations
Integrations allow to configure connections with various data sources such as Grafana, InfluxDB, and so forth. It's crucial to properly set up these connections, as this tool operates closely with them.
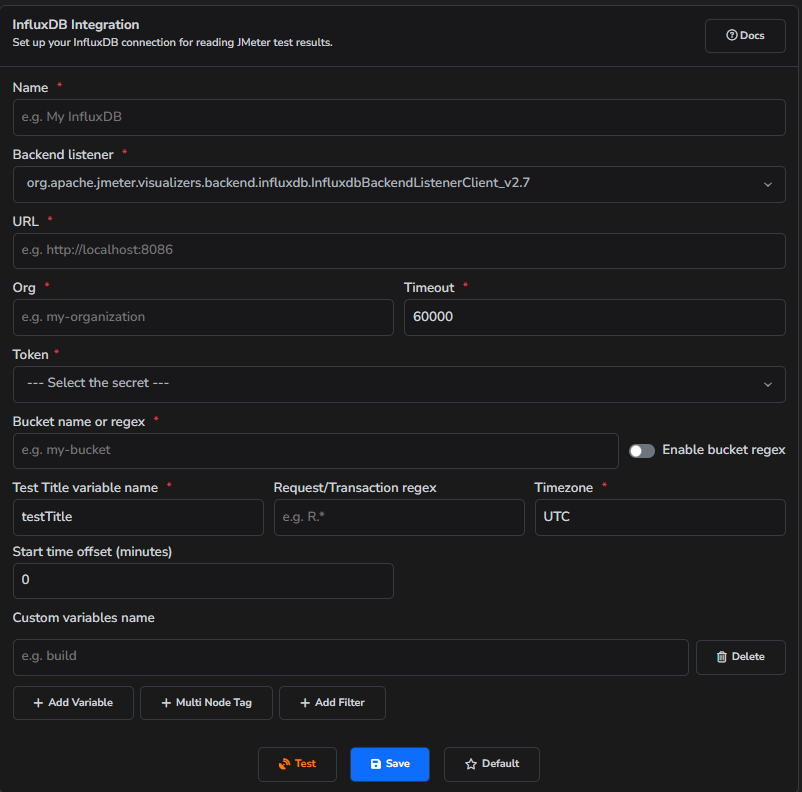
InfluxDB
The InfluxDB configuration allows you to connect to InfluxDB, modify it, and utilize it in reporting.
How to add
- First, open the "Integrations" tab.
- Choose "InfluxDB" tab.
- Then click on "Add new config".
- Fill in all necessary fields.
- Click "Save" button.
Currently, PerForge supports five backend listeners so you can query either InfluxDB v2 or InfluxDB 1.8 schemes:
- org.apache.jmeter.visualizers.backend.influxdb.InfluxdbBackendListenerClient_v2.7 – standard JMeter listener for InfluxDB v2.7 installations.
- sitespeed_influxdb_v2.7 – Sitespeed.io queries that expect data published via the InfluxDB plugin to an InfluxDB v2.7 bucket.
- org.apache.jmeter.visualizers.backend.influxdb.InfluxdbBackendListenerClient_v1.8 – JMeter listener variant tailored for legacy InfluxDB 1.8 instances.
- sitespeed_influxdb_v1.8 – Sitespeed.io queries aligned with the plugin output stored in InfluxDB 1.8 bucket.
- gatling_influxdb_v2 (BETA) – Gatling metrics ingested via Telegraf Graphite input into an InfluxDB v2 bucket. See the Gatling setup section below.
Backend listeners determine the data structure in InfluxDB, so choose the one that matches both your tool (JMeter, Sitespeed.io, or Gatling) and the InfluxDB version you are running. If you use a different backend listener/plugin, you won’t be able to use this tool.
A significant portion of the communication logic depends on InfluxDB tags. In the integration configuration, there’s an option called ‘Test Title Tag Name’ where you can specify any tag to be sent along with JMeter or Sitespeed.io test data. This tag should be unique to ensure that the results are grouped correctly for each test.
Note: In JMeter, you need to explicitly define the test title tag, such as TAG_testTitle.
You have the option to filter Requests or Transactions. For instance, if you only want to analyze requests, you can use "R.*" as a filter, provided all your requests follow this pattern. This largely depends on your naming convention. If you don’t want to apply any filtering, simply leave the field empty.
Additionally, it’s possible to retrieve custom values from InfluxDB. For instance, when saving a build, you can specify a custom tag, which can then be queried and used as a parameter. For example, if you define a build in the report, you can reference it using variables like ${current_build} or ${baseline_build}.
InfluxDB configuration
The table below describes the key fields in the InfluxDB integration form. The values apply to all listeners; the Example column shows typical values for JMeter and Gatling where they differ.
| Field | Description | JMeter example | Gatling example |
|---|---|---|---|
| Listener | Determines the data schema PerForge expects in InfluxDB | org.apache.jmeter... | gatling_influxdb_v2 (BETA) |
| Bucket | InfluxDB bucket where your test data is stored | jmeter | gatling |
| Test Title Tag Name | The tag that identifies a unique test run | testTitle | testTitle |
| Transaction regex | Optional filter applied to transaction/request names | R.* | R.* |
| Custom filter tags | Additional tag conditions used when fetching the test title list; useful when one bucket holds multiple tools or simulations and you want only a subset to appear in the tests tab | tag=env, value=prod | tag=simulation, value=basicsimulation |
| Multi Node Tag | Tag that identifies individual nodes in a distributed run; PerForge sums active users across nodes | host | host |
| Start time offset | Shifts the detected start time forward by N minutes to exclude the unstable ramp-up phase from aggregated data and analysis | 0 | 0 |
| Custom variables | Tag names whose values are fetched and exposed as template variables (e.g. ${current_build}) | build | simulation |
Gatling InfluxDB v2 (BETA)
Gatling does not write directly to InfluxDB — it publishes metrics over the Graphite protocol, and Telegraf receives them and stores them in InfluxDB v2. A Telegraf template is required to split the Graphite path into proper InfluxDB tags. Without it, the full dotted path becomes the measurement name and nothing will query correctly.
Data pipeline
Gatling → Graphite (TCP :2003) → Telegraf → InfluxDB v2
The Graphite path has 6 segments:
gatling.<testTitle>.<simulation>.<request>.<status>.<field>
Telegraf maps them to InfluxDB tags and fields:
| Path segment | InfluxDB key | Example value |
|---|---|---|
gatling | _measurement | gatling |
<testTitle> | tag testTitle | run_20240318_1030 |
<simulation> | tag simulation | basicsimulation |
<request> | tag request | HomePage, allRequests, users |
<status> | tag status | ok, ko, all, allUsers |
<field> | _field | count, mean, percentiles50, active |
Telegraf configuration
[[inputs.graphite]]
  listen = ":2003"
  protocol = "tcp"
  templates = [
    "gatling.*.*.*.*.* measurement.testTitle.simulation.request.status.field"
  ]

[[outputs.influxdb_v2]]
  urls = ["http://your-influxdb-host:8086"]
  token = "your-api-token"
  org = "your-org"
  bucket = "gatling"
The template must match the exact number of path segments. The 6-segment template above works only when rootPathPrefix contains exactly two segments (e.g. gatling.<runId>). If you add extra segments (see Custom variables below), update the template accordingly.
Gatling launch
The rootPathPrefix must be unique per test run. Use a timestamp or CI build ID to ensure each run is stored separately in InfluxDB:
TEST_RUN_ID="run_$(date +%Y%m%d_%H%M%S)"
./gatling.sh -Dgatling.data.graphite.rootPathPrefix=gatling.${TEST_RUN_ID}
If you reuse the same prefix across runs, all runs merge into a single entry in InfluxDB and PerForge will show only one test in the list.
Custom variables for Gatling
Custom variables work by fetching a tag value from InfluxDB. With the default 6-segment setup, the available tags are simulation, host (added automatically by Telegraf), and any tag added by your Telegraf configuration.
If you need to store additional metadata per run (e.g. environment, build version), embed it as an extra path segment and extend the Telegraf template:
Gatling launch:
./gatling.sh -Dgatling.data.graphite.rootPathPrefix=gatling.${TEST_RUN_ID}.staging
Telegraf template (7 segments):
templates = [
  "gatling.*.*.*.*.*.* measurement.testTitle.environment.simulation.request.status.field"
]
This makes environment a real InfluxDB tag that you can then use as a custom variable in PerForge (e.g. ${current_environment}).
If you need both 6-segment and 7-segment runs to coexist in the same bucket, Telegraf supports multiple templates. Place the longer (more specific) one first, as Telegraf applies the first matching template:
templates = [
  "gatling.*.*.*.*.*.* measurement.testTitle.environment.simulation.request.status.field",
  "gatling.*.*.*.*.* measurement.testTitle.simulation.request.status.field"
]
Unsupported features
The following features available for JMeter are not supported for Gatling:
| Feature | Reason |
|---|---|
| InfluxDB 1.8 | Only InfluxDB v2 is supported (gatling_influxdb_v2). There is no gatling_influxdb_v1.8 listener. |
| 90th percentile | Gatling does not emit a 90th percentile field. The closest available field is percentiles95, which PerForge uses in place of pct90 for all Gatling reports. |
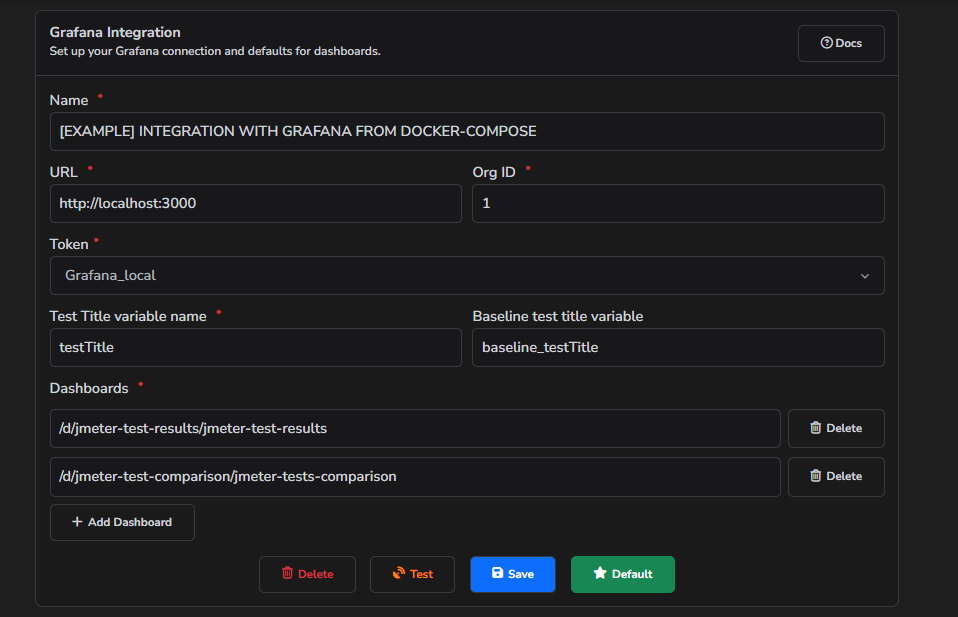
Grafana
The Grafana configuration enables us to establish a connection with a rendering plugin. This plugin is capable of rendering Grafana screenshots. Which then will be used in reports.
How to add
- First, open the "Integrations" tab.
- Choose "Grafana" tab.
- Then click on "Add new config".
- Fill in all necessary fields.
- Click "Save" button.
Alongside PerForge, we provide several Grafana dashboards that should be used for reporting (you can find them here). Indeed, you can use your own dashboards and add them as well. However, to ensure they work correctly, it's crucial to utilize the same variables and names as in the provided dashboards.
If you're using your own Grafana instance, you'll need to install the rendering plugin. Learn more about it here: grafana-image-renderer
To render a Grafana screenshot, please specify the appropriate tag names for the test title and baseline test title used on your dashboards. If you are using our default dashboards, you can leave the default values. If you are using custom dashboards, ensure that the current test title has the same tag name across all dashboards.
The dashboard URL can be taken from the Grafana URL:
/d/jmeter-test-results-standard-listener/jmeter-test-results-standard-listeneris the Dashboard URL.
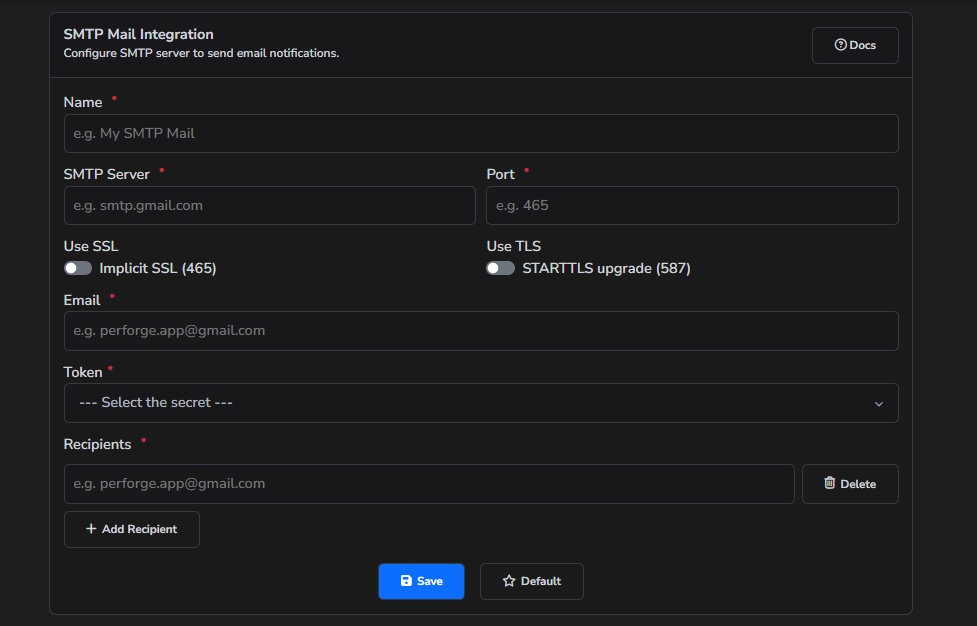
SMTP Mail
Mail is one of the target sources where the tool can create a report.
How to add
- First, open the "Integrations" tab.
- Choose "SMTP Mail" tab.
- Then click on "Add new config".
- Fill in all necessary fields.
- Click "Save" button.
Instructions for using Google SMTP Server:
-
Generate an App Password: You will first need to obtain an 'App Password' from your Google account. Use the 'App Password' in the password field when setting up the integration SMTP Mail.
-
Enable POP and IMAP: Ensure that both POP and IMAP options are enabled on your Google account. This allows the application to communicate with your email account.
Detailed instructions for generating an App Password and enabling POP and IMAP can be found here: gmail-smtp.
-
For the server, use the following address: smtp.gmail.com.
-
Depending on your security requirements, you have the option to use either one of two ports:
- Port 465 (if secure connection is required, set SSL: true, and TLS: false)
Atlassian Confluence
Atlassian Confluence is one of the target sources where the tool can create a report.
How to add
- First, open the "Integrations" tab.
- Choose "Confluence" tab.
- Then click on "Add new config".
- Fill in all necessary fields.
- Click "Save" button.
There are two types of tokens: one is an API token, which acts as a password, and the other is a Personal Access Token, which acts as both an email and a password. Be careful when creating a token; make sure to specify which type of token it is.
To create a Personal Access Token, please follow these instructions: personal-access-token-to-authenticate.
To create a API token, please follow these instructions: api-token-to-authenticate.
All necessary parameters can be taken from the URL of the page where the reports will be created:
https://perforge.atlassian.net/wiki/spaces/MFS/pages/557057/JMeter+tests
https://perforge.atlassian.netis the Organization URLMFSis the Space key557057is the Parent ID

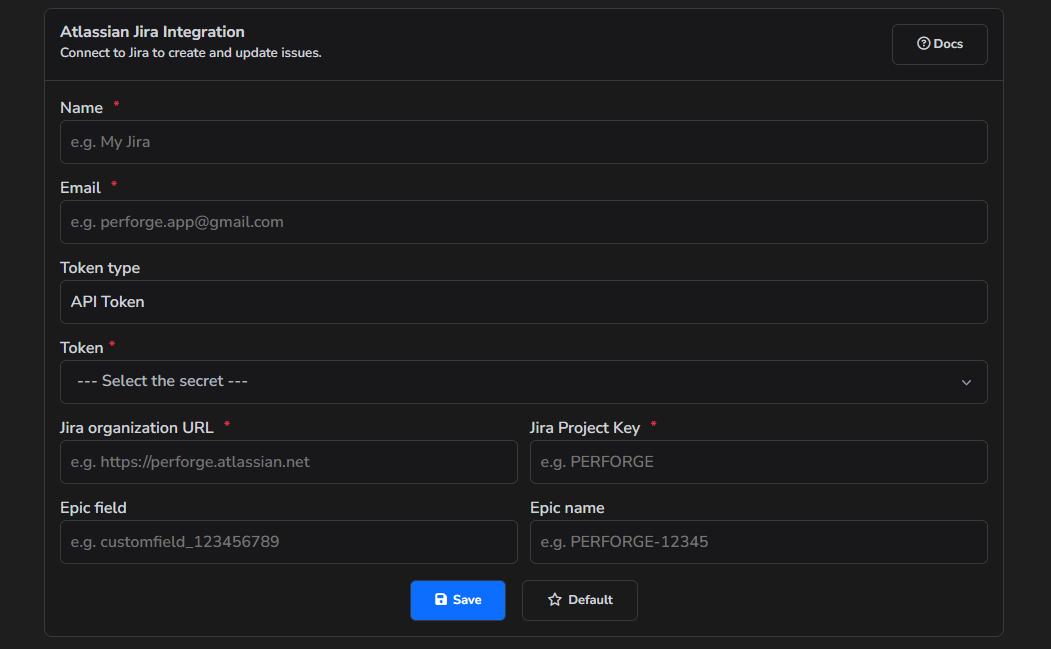
Atlassian Jira
Atlassian Jira is one of the target sources where the tool can create a report.
How to add
- First, open the "Integrations" tab.
- Choose "Jira" tab.
- Then click on "Add new config".
- Fill in all necessary fields.
- Click "Save" button.
There are two types of tokens: one is an API token, which acts as a password, and the other is a Personal Access Token, which acts as both an email and a password. Be careful when creating a token; make sure to specify which type of token it is.
To create a Personal Access Token, please follow these instructions: personal-access-token-to-authenticate.
To create a API token, please follow these instructions: api-token-to-authenticate.
Project parameter can be taken from the URL of the projects board:
https://perforge.atlassian.net/jira/software/projects/PF/boards/1
PFis the Project
The Epic field and Epic name are used to link a ticket to a specific epic.
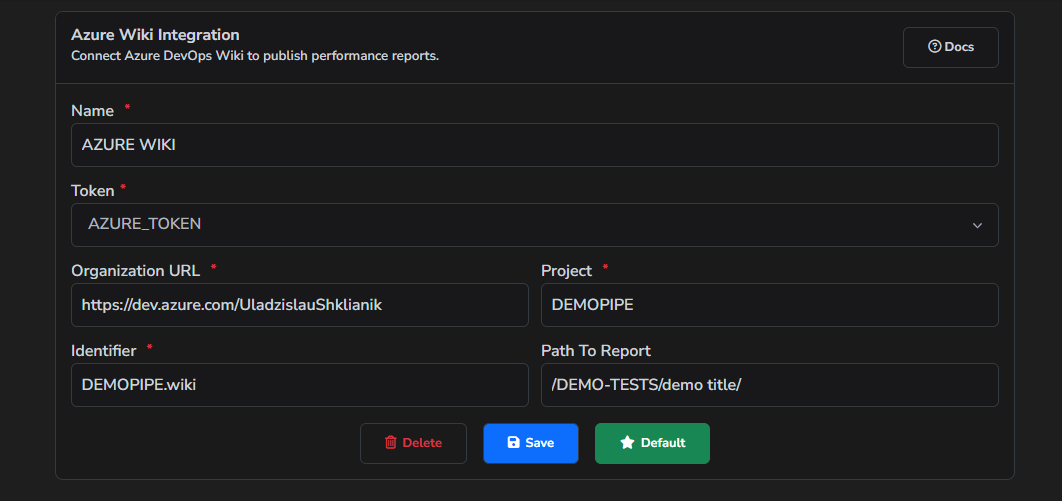
Azure Wiki
Azure Wiki is one of the target sources where the tool can create a report.
How to add
- First, open the "Integrations" tab.
- Choose "Azure" tab.
- Then click on "Add new config".
- Fill in all necessary fields.
- Click "Save" button.
To create a personal access token, please follow these instructions: access-tokens-to-authenticate.
If the specified path does not exist, it will be automatically created.
All necessary parameters can be taken from the URL of the page where the reports will be created:
https://dev.azure.com/perfroge/PERFORGEPROJECT/_wiki/wikis/PERFORGEPROJECT.wiki/59/JMETER-REPORTS
https://dev.azure.com/perfrogeis the Wiki Organization UrlPERFORGEPROJECTis the Wiki ProjectPERFORGEPROJECT.wikiis the Wiki Identifier
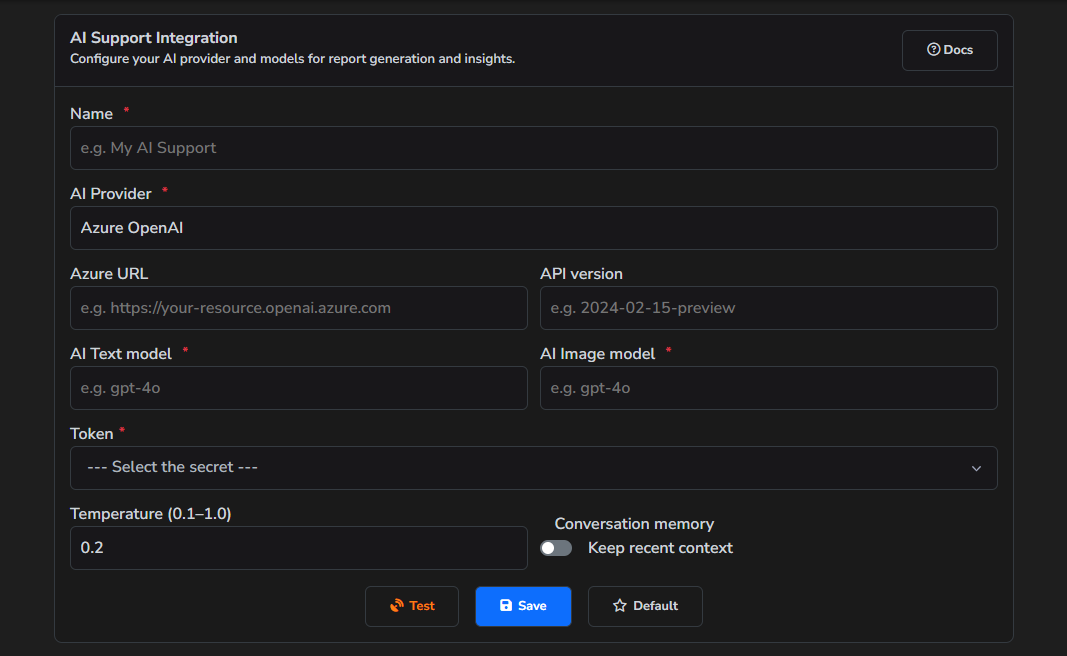
AI Support
AI Support allows you to use AI to analyze performance test results, create summaries for aggregated data and graphs.
How to add
- First, open the "Integrations" tab.
- Choose "AI Support" tab.
- Then click on "Add new config".
- Fill in all necessary fields.
- Click "Save" button.
We support the use of OpenAI, Azure OpenAI, Google Gemini and Anthropic providers. You can use any available models with your token.
Additoonaly there is possibility to use conversation memory, more about this feature can be found here: analysis-process.
- The "AI Image" model should support image inputs.
- "Conversation memory" will at least double the token usage.
- The "Default" integration is used automatically when reporting; if you have multiple integrations, be sure the correct one is set as the default.