Integrations
Integrations allow to configure connections with various data sources such as Grafana, InfluxDB, and so forth. It's crucial to properly set up these connections, as this tool operates closely with them.
InfluxDB
The InfluxDB configuration allows you to connect to InfluxDB, modify it, and utilize it in reporting.
How to add
- First, open the "Integrations" tab.
- Choose "InfluxDB" tab.
- Then click on "Add new config".
- Fill in all necessary fields.
- Click "Save" button.
Currently, PerForge supports two versions of backend listeners to query data from Influxdb v2:
- org.apache.jmeter.visualizers.backend.influxdb.InfluxdbBackendListenerClient: This is the standard one provided out of the box by JMeter.
- sitespeed_influxdb_v2: A set of queries designed to analyze Sitespeed.io metrics that have been sent to InfluxDB using the (InfluxDB plugin.).
Backend listeners determine the data structure in InfluxDB, so it's crucial to choose the correct one. If you use a different backend listener/plugin, you won't be able to use this tool.
A significant portion of the communication logic depends on InfluxDB tags. In the integration configuration, there's an option called 'Test Title Tag Name' where you can specify any tag to be sent along with JMeter or Sitespeed.io test data. This tag should be unique to ensure that the results are grouped correctly for each test.

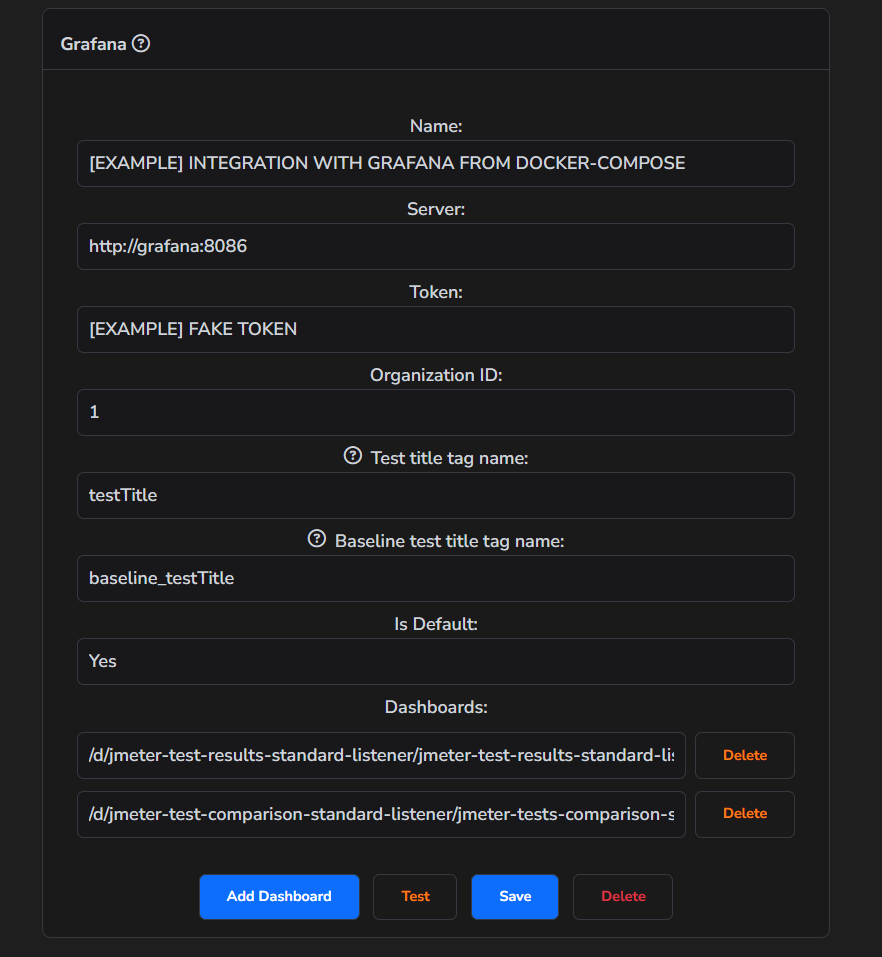
Grafana
The Grafana configuration enables us to establish a connection with a rendering plugin. This plugin is capable of rendering Grafana screenshots. Which then will be used in reports.
How to add
- First, open the "Integrations" tab.
- Choose "Grafana" tab.
- Then click on "Add new config".
- Fill in all necessary fields.
- Click "Save" button.
Alongside PerForge, we provide several Grafana dashboards that should be used for reporting (you can find them here). Indeed, you can use your own dashboards and add them as well. However, to ensure they work correctly, it's crucial to utilize the same variables and names as in the provided dashboards.
If you're using your own Grafana instance, you'll need to install the rendering plugin. Learn more about it here: grafana-image-renderer
To render a Grafana screenshot, please specify the appropriate tag names for the test title and baseline test title used on your dashboards. If you are using our default dashboards, you can leave the default values. If you are using custom dashboards, ensure that the current test title has the same tag name across all dashboards.
The dashboard URL can be taken from the Grafana URL:
/d/jmeter-test-results-standard-listener/jmeter-test-results-standard-listeneris the Dashboard URL.
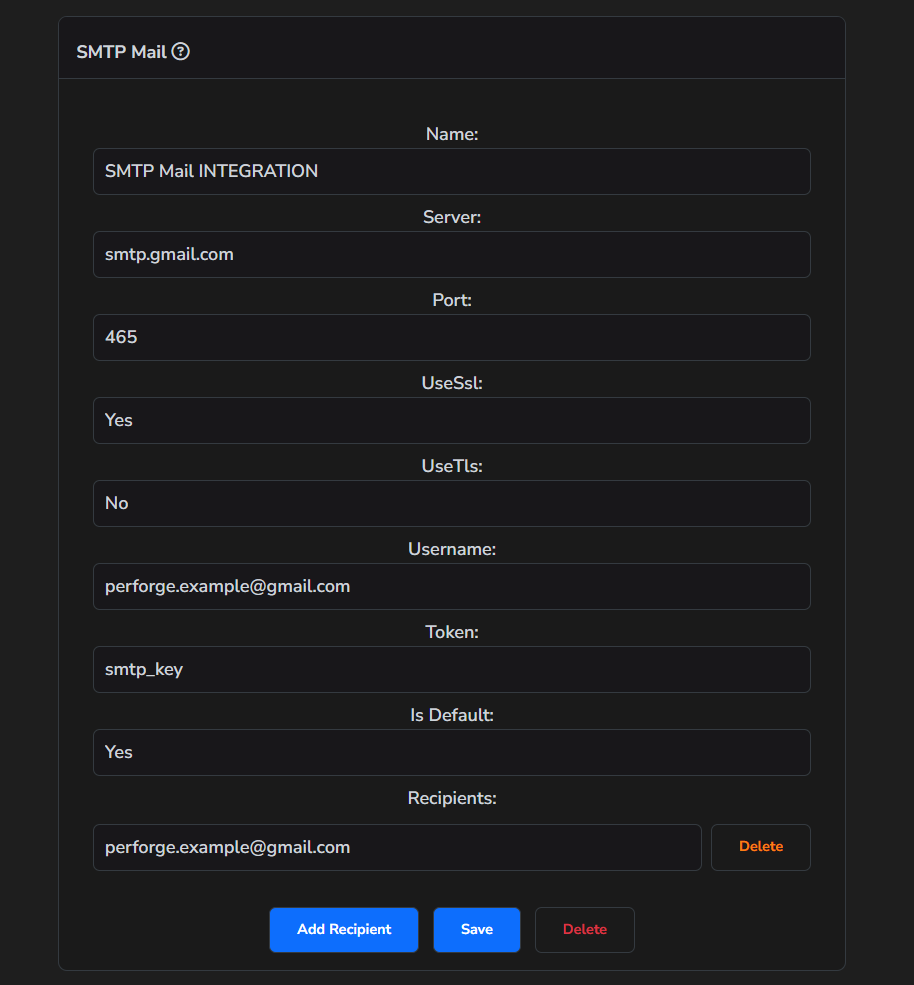
SMTP Mail
Mail is one of the target sources where the tool can create a report.
How to add
- First, open the "Integrations" tab.
- Choose "SMTP Mail" tab.
- Then click on "Add new config".
- Fill in all necessary fields.
- Click "Save" button.
Instructions for using Google SMTP Server:
-
Generate an App Password: You will first need to obtain an 'App Password' from your Google account. Use the 'App Password' in the password field when setting up the integration SMTP Mail.
-
Enable POP and IMAP: Ensure that both POP and IMAP options are enabled on your Google account. This allows the application to communicate with your email account.
Detailed instructions for generating an App Password and enabling POP and IMAP can be found here: gmail-smtp.
-
For the server, use the following address: smtp.gmail.com.
-
Depending on your security requirements, you have the option to use either one of two ports:
- Port 465 (if secure connection is required, set SSL: true, and TLS: false)
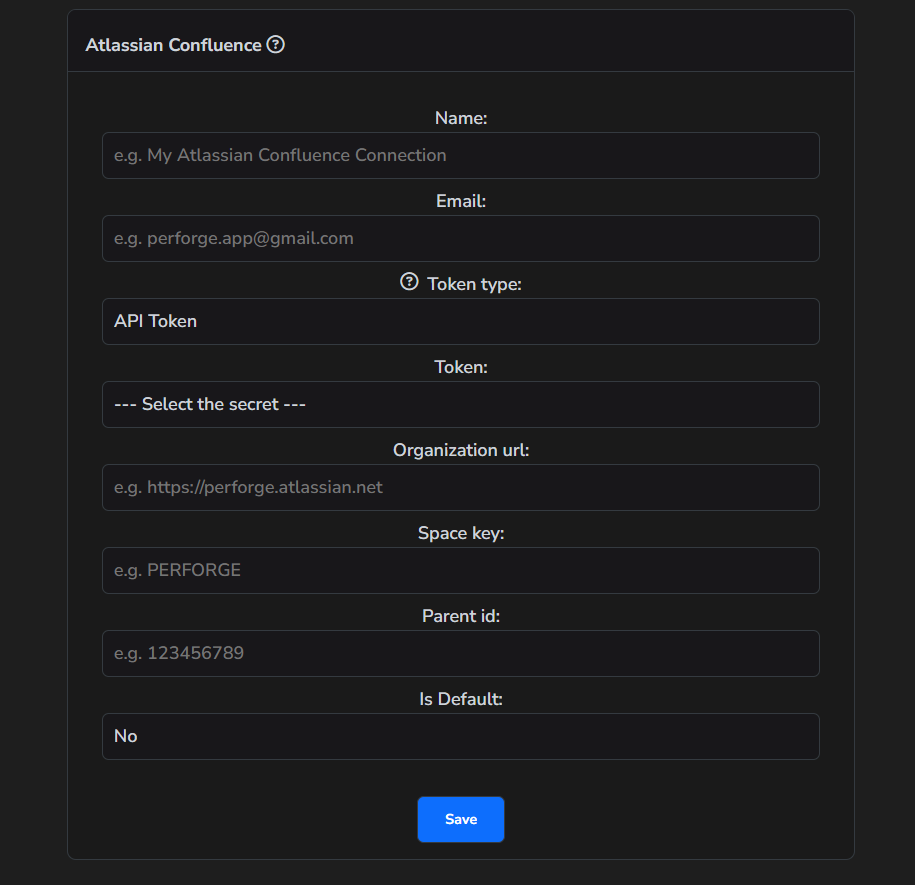
Atlassian Confluence
Atlassian Confluence is one of the target sources where the tool can create a report.
How to add
- First, open the "Integrations" tab.
- Choose "Confluence" tab.
- Then click on "Add new config".
- Fill in all necessary fields.
- Click "Save" button.
There are two types of tokens: one is an API token, which acts as a password, and the other is a Personal Access Token, which acts as both an email and a password. Be careful when creating a token; make sure to specify which type of token it is.
To create a Personal Access Token, please follow these instructions: personal-access-token-to-authenticate.
To create a API token, please follow these instructions: api-token-to-authenticate.
All necessary parameters can be taken from the URL of the page where the reports will be created:
https://perforge.atlassian.net/wiki/spaces/MFS/pages/557057/JMeter+tests
https://perforge.atlassian.netis the Organization URLMFSis the Space key557057is the Parent ID
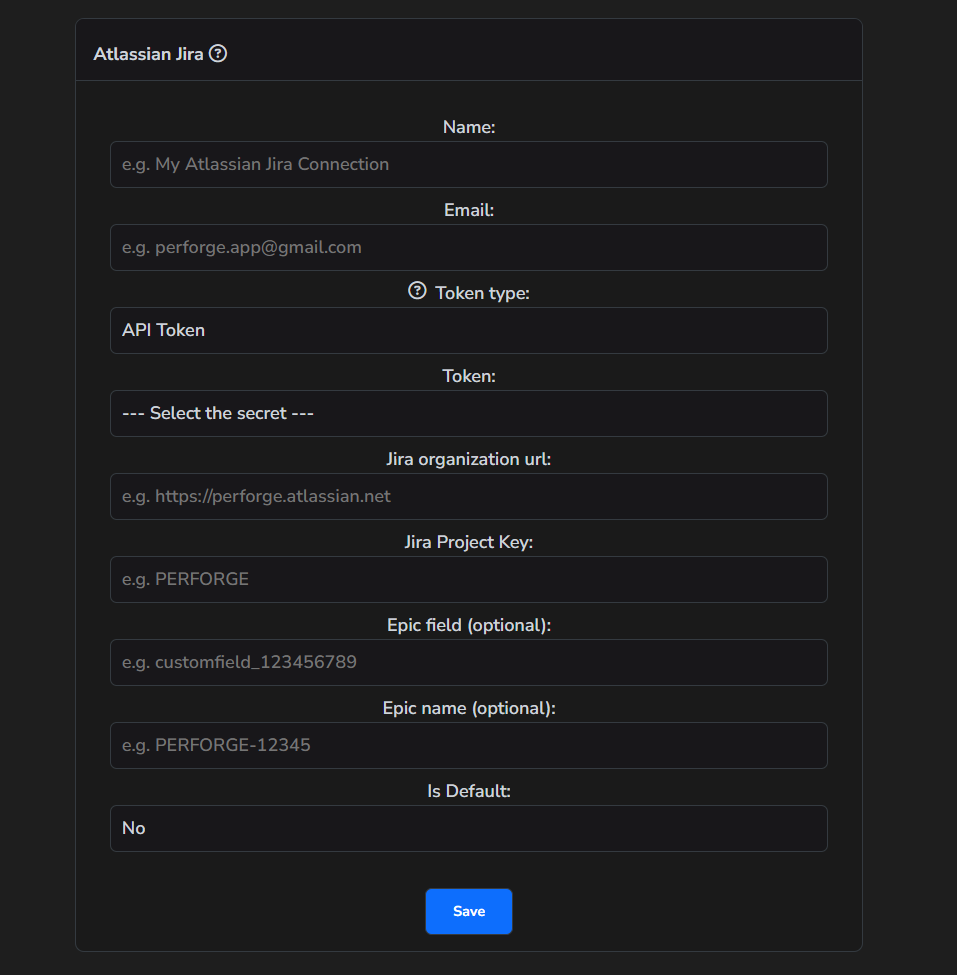
Atlassian Jira
Atlassian Jira is one of the target sources where the tool can create a report.
How to add
- First, open the "Integrations" tab.
- Choose "Jira" tab.
- Then click on "Add new config".
- Fill in all necessary fields.
- Click "Save" button.
There are two types of tokens: one is an API token, which acts as a password, and the other is a Personal Access Token, which acts as both an email and a password. Be careful when creating a token; make sure to specify which type of token it is.
To create a Personal Access Token, please follow these instructions: personal-access-token-to-authenticate.
To create a API token, please follow these instructions: api-token-to-authenticate.
Project parameter can be taken from the URL of the projects board:
https://perforge.atlassian.net/jira/software/projects/PF/boards/1
PFis the Project
The Epic field and Epic name are used to link a ticket to a specific epic.
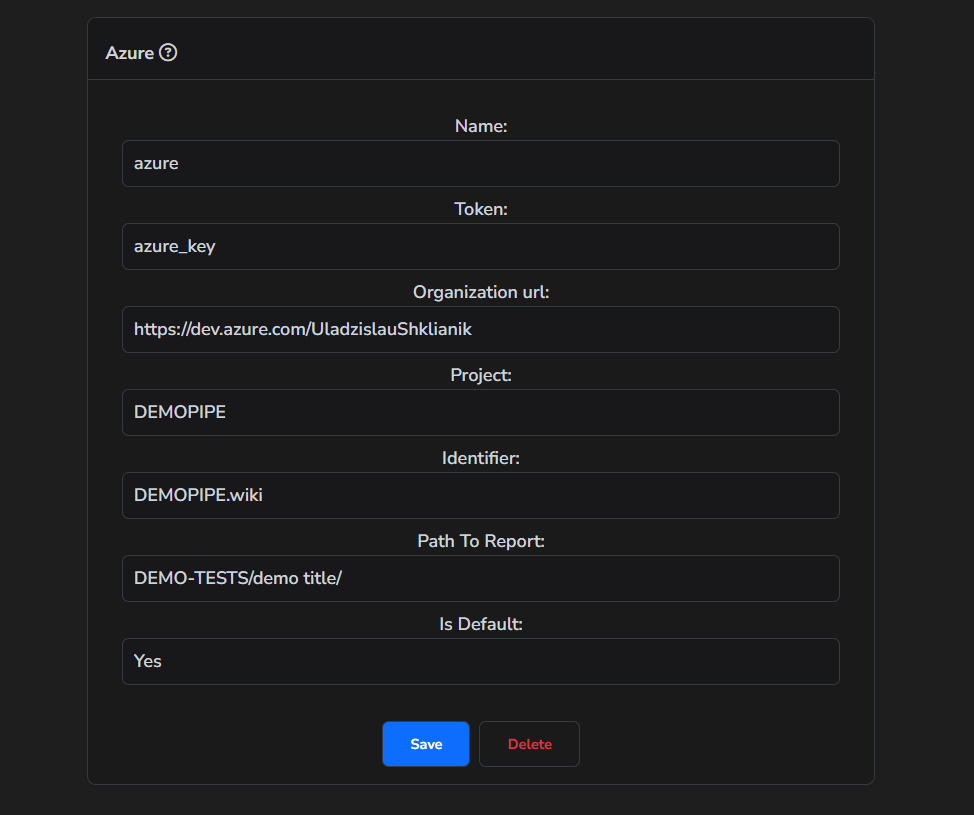
Azure Wiki
Azure Wiki is one of the target sources where the tool can create a report.
How to add
- First, open the "Integrations" tab.
- Choose "Azure" tab.
- Then click on "Add new config".
- Fill in all necessary fields.
- Click "Save" button.
To create a personal access token, please follow these instructions: access-tokens-to-authenticate.
If the specified path does not exist, it will be automatically created.
All necessary parameters can be taken from the URL of the page where the reports will be created:
https://dev.azure.com/perfroge/PERFORGEPROJECT/_wiki/wikis/PERFORGEPROJECT.wiki/59/JMETER-REPORTS
https://dev.azure.com/perfrogeis the Wiki Organization UrlPERFORGEPROJECTis the Wiki ProjectPERFORGEPROJECT.wikiis the Wiki Identifier
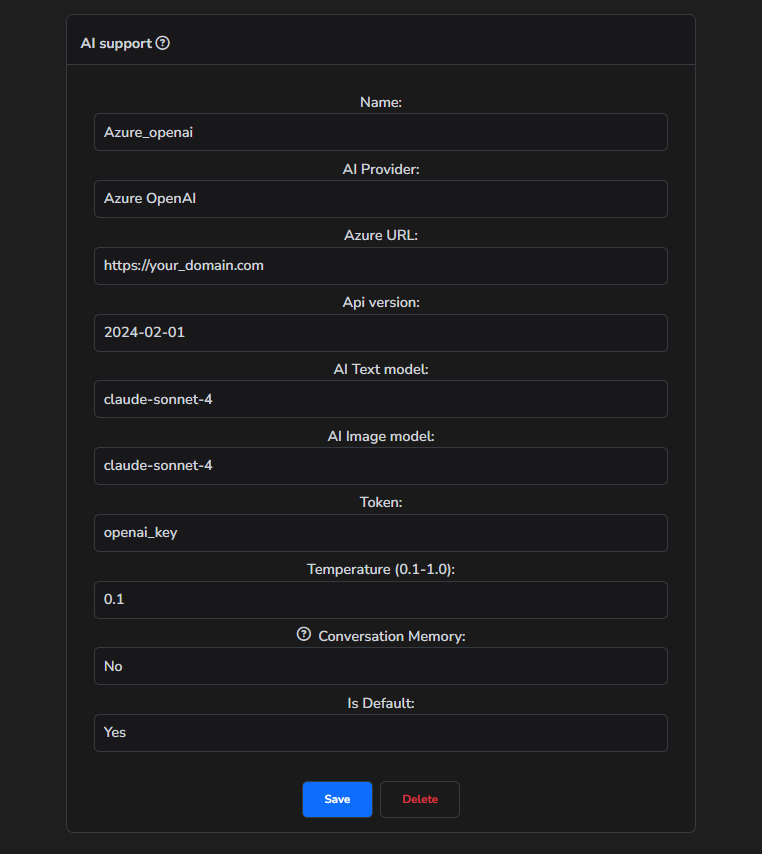
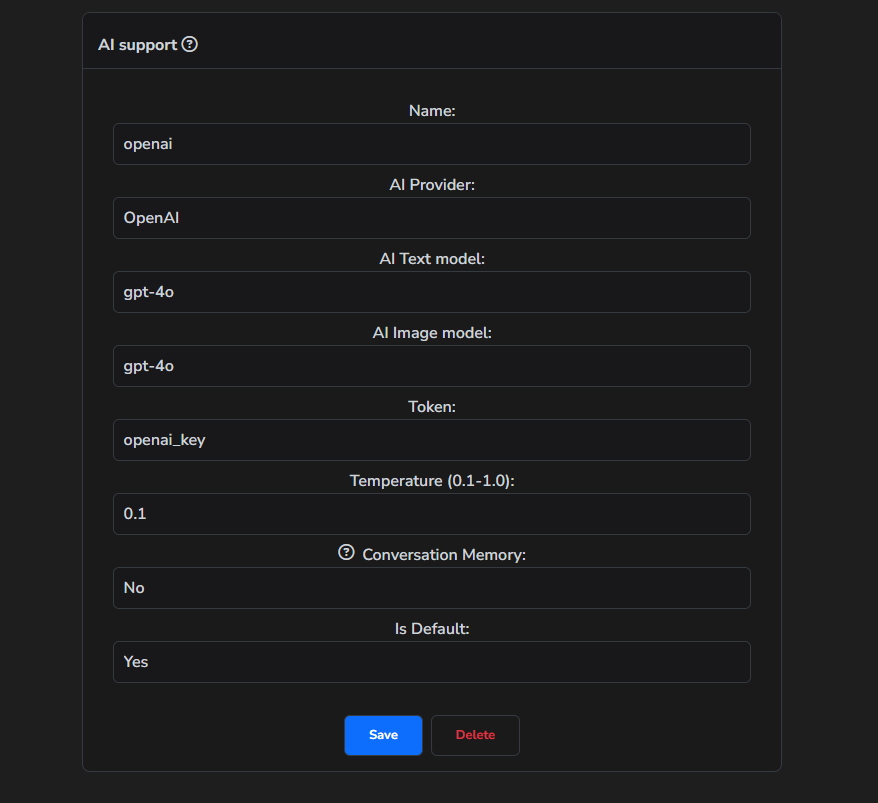
AI Support
AI Support allows you to use AI to analyze performance test results, create summaries for aggregated data and graphs.
How to add
- First, open the "Integrations" tab.
- Choose "AI Support" tab.
- Then click on "Add new config".
- Fill in all necessary fields.
- Click "Save" button.
We support the use of OpenAI, Azure OpenAI and Google Gemini models. You can use any available models with your token.
For OpenAI and Azure OpenAI, the following models are recommended:
- Text model:
gpt-4orgpt-4-turboorgpt-4o - Image model:
gpt-4-turboorgpt-4o
For Gemini, we have tested and recommend using the following models:
- Text model:
gemini-2.5-pro - Image model:
gemini-2.5-pro
Note: In Azure deployment, you can use any available model, including Claude models.
There is possibility to use conversation memory, more about this feature can be found here: analysis-process.
OpenAI
Azure OpenAI