Graphs
Graphs are used to specify which Grafana panels should be rendered.
How to add
- First, open the "Graphs" tab.
- Then click on "Add graph".
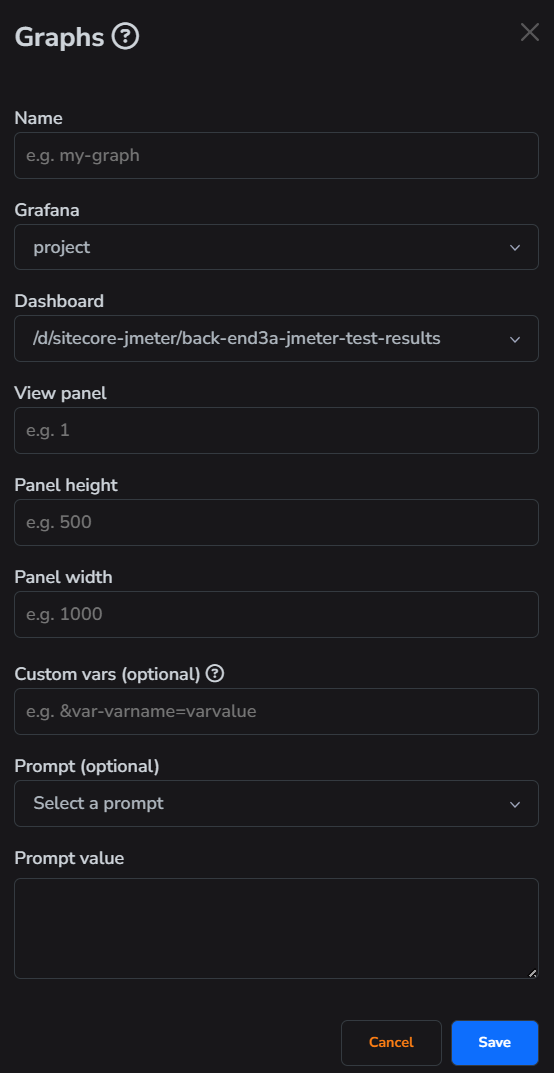
- Fill in all necessary fields.
- Click "Save" button.
info
The view panel is a unique identifier for each Grafana panel. To get this ID, simply open the panel in view mode and you can find the ID in the URL:
4is the View panel
info
The "Custom vars" option lets you specify custom Grafana parameters needed to render the graph. You can set as many custom variables as you'd like.
warning
If you don't specify a prompt, this graph won't be usable in a template with graph analysis enabled.