Templates
The template feature allows you to create a report pattern, which can be used for automated reporting.
How to add
As a prerequisite, all integrations, graphs or NFRs should be added before creating a template.
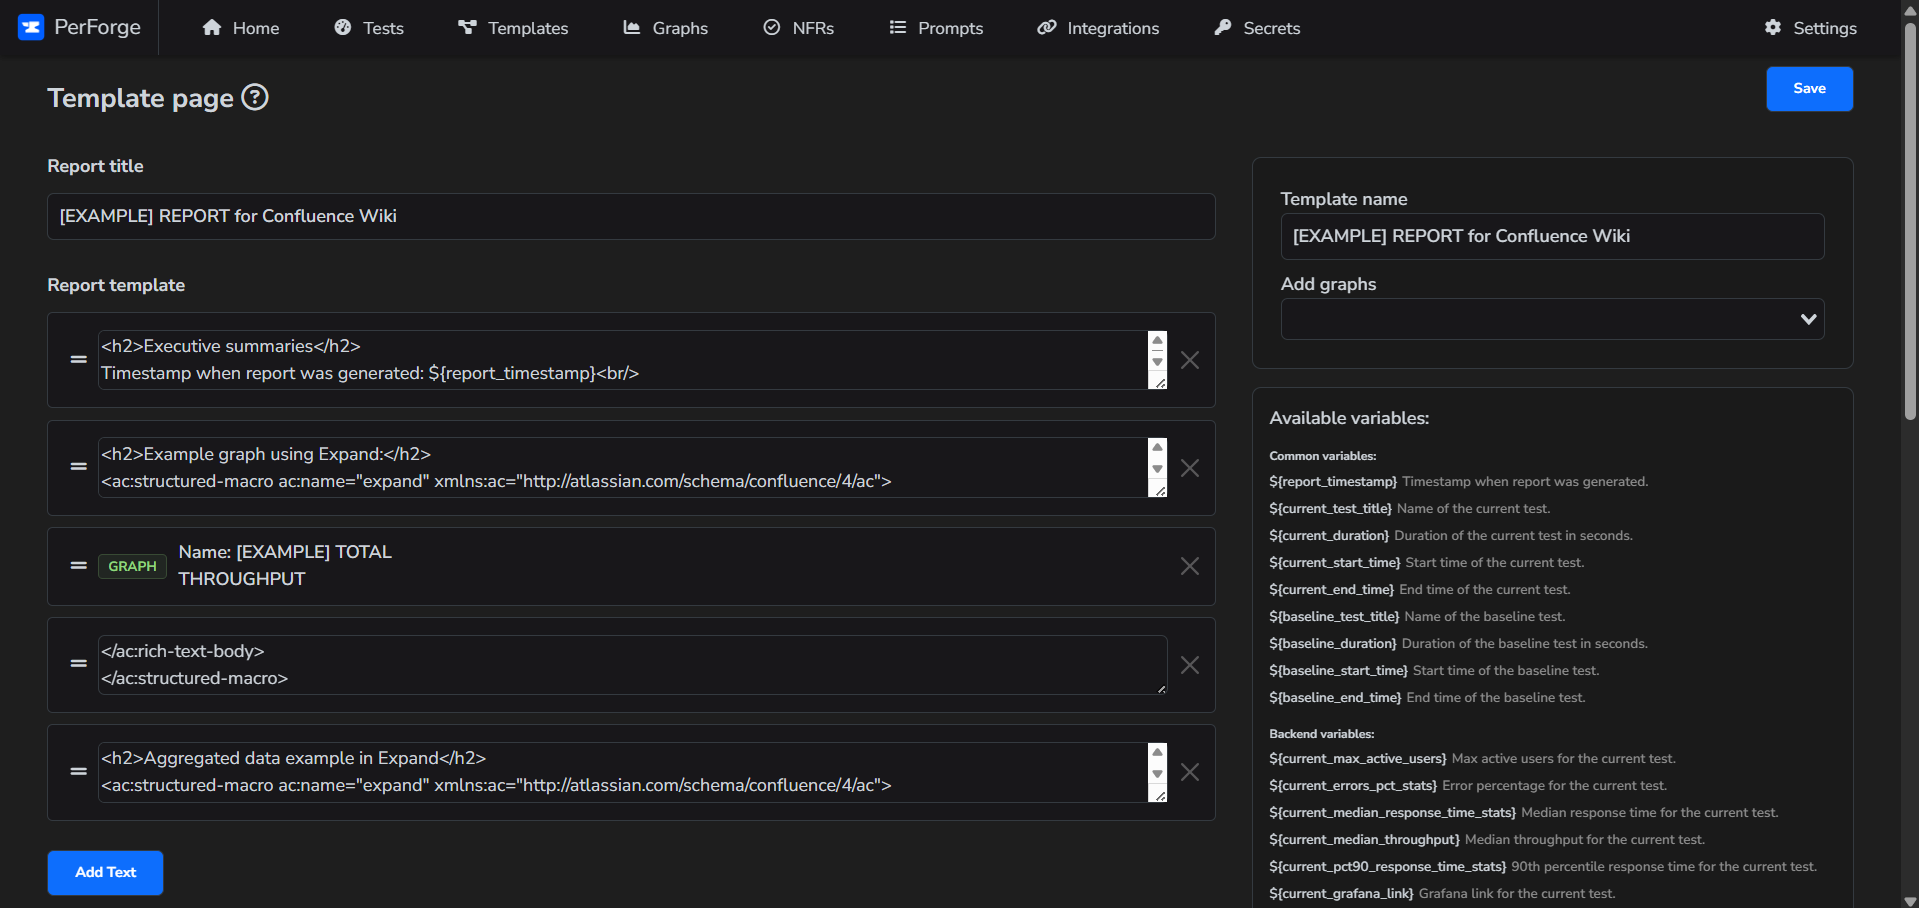
- First, open the "Templates" tab.
- Then click on "Add template".
- To add a text block clik on "Add Text" button.
- To add a graph select desired graph from "Add graphs" field.
- You can drag and drop various elements.
- Click "Save" button.
Please explore the available settings in the checkboxes and variables listed below.
Template tips
Available variables
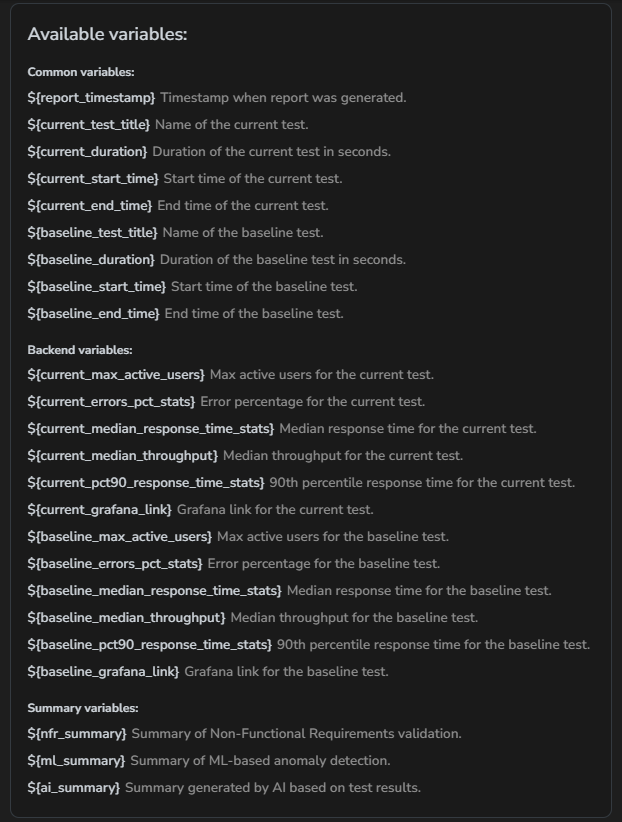
On the right side of the template editor, you'll find a list of available variables that can be used within the text blocks. Simply click on the variable, and it will be copied to your clipboard. Then, place it in any text block, and it will be replaced with the actual value. These variables are categorized as follows:
- Common variables: These can be used in templates for both Backend and Frontend tests.
- Backend variables: These are exclusively for use in templates designed for Backend tests.
- Summary variables: Each can be used for Backend testing. Frontend testing can utilize NFR and AI, but not ML. ML is specifically designed for Backend tests only. These variables will store the analysis and can be included anywhere in your report - simply place them in any text block and ensure the corresponding checkbox is enabled.
Available tables
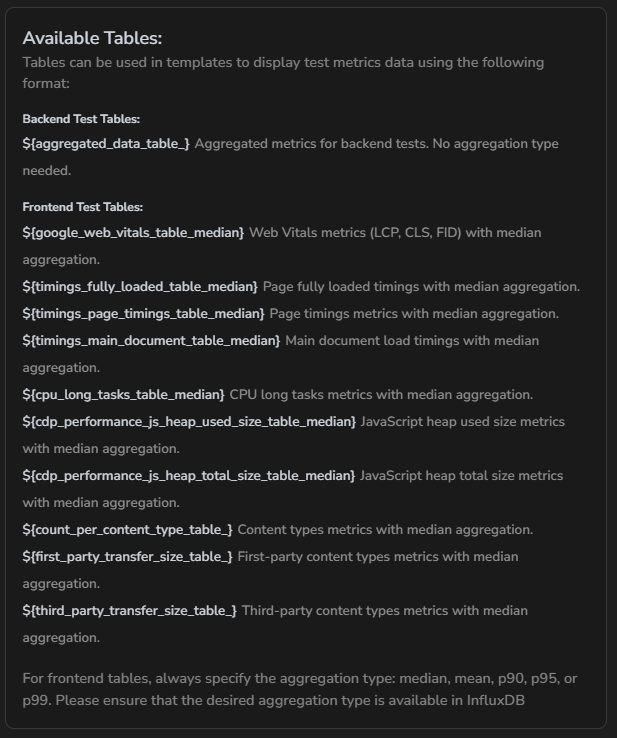
You can include tables with results in the report. The tables will be properly formatted based on the report's output. If you provide a baseline, two values for each metric and scope will be displayed in the format: 'baseline > current'. If the current value is more than 10% slower than the baseline, it will be highlighted in red. The following types of tables are available:
- Backend test tables: This is simply a collection of aggregated metrics for your JMeter test.
- Frontend test tables: Here, you can select various tables with different metrics. If you notice "_median" at the end, it means you can customize the aggregation, such as p90, p95, or others. Just ensure that the desired aggregation is available in InfluxDB.
If you're including tables in a PDF report, make sure the table variable is placed in its own separate text block, away from other text. Otherwise, it won't render correctly.
Checkboxes
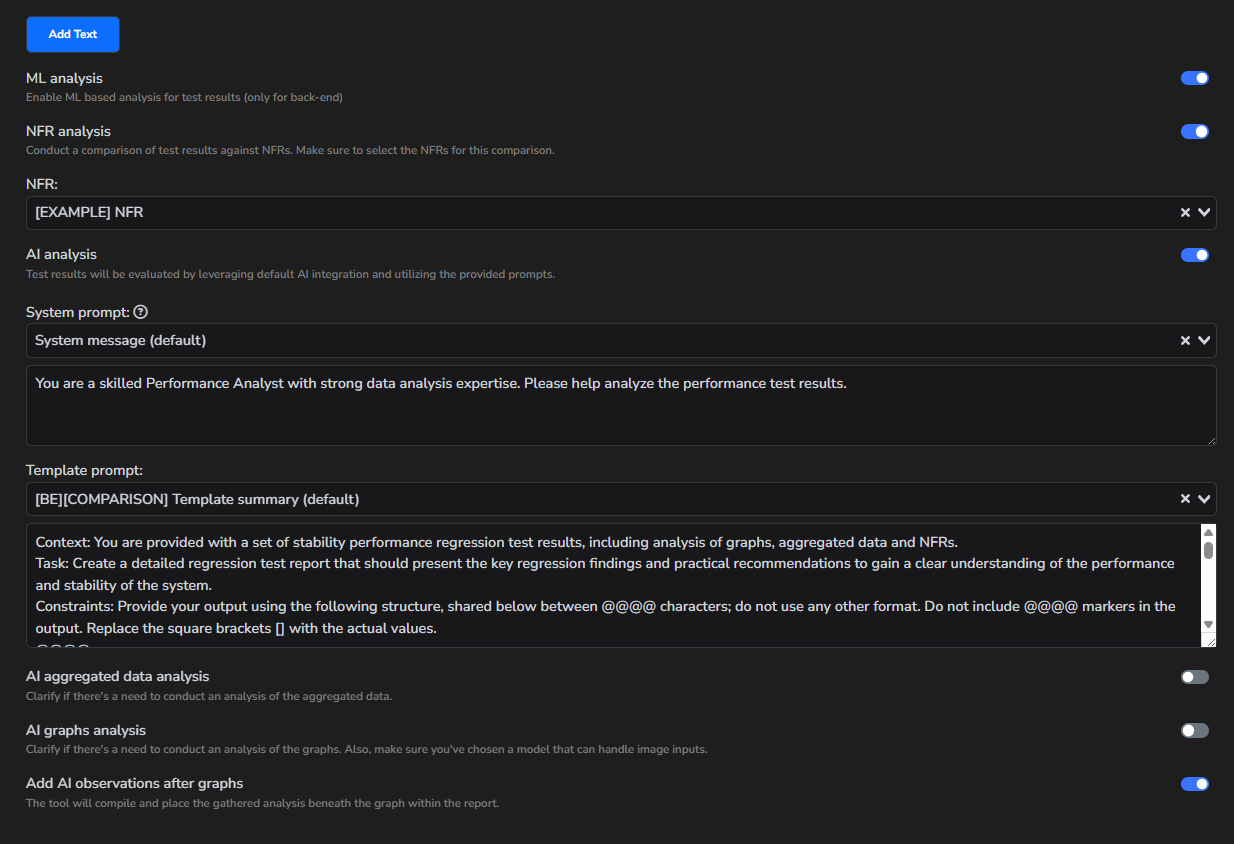
"ML analysis" - If you check this box, the Backend test data from InfluxDB will be processed by the internal analytical engine. It will check for anomalies, consistent trends, and whether the metric is stable. The results will then be saved in the variable ${ml_summary}.
"NFRs" - By selecting this checkbox, data analysis will be conducted based on the specified thresholds. Once checked, you'll need to choose which set of NFRs to use. As a result of the NFR analysis, the outcomes will be stored in the variable ${nfrs_summary}.
"AI analysis" - If you check this box, AI will be used to analyze your test results. Once selected, you'll need to choose a "System prompt" and a "Template prompt." Additionally, when this option is checked, you can decide whether or not to analyze the aggregated data and graphs. As a result, the analysis will be stored in the variable ${ai_summary}.
"AI aggregated data analysis" - With this checkbox, the aggregated data of the test will also be processed by AI, and this analysis will be used to form the overall AI summary.
"AI graphs analysis" - With this checkbox, the graphs rendered in Grafana will also be processed by AI, and this analysis will be used to form the overall AI summary.
"Add AI observations after graphs" - This checkbox allows you to add the analysis of each graph to the report below them.
How to add a new block
A template has two types of blocks: text and graph. To add a text block, simply click the corresponding button. If you want to add a graph, search for it in the "Add graph" field.
Additionally, the order of the blocks can be adjusted by clicking on a block and dragging it to the desired position.
Markdown
Depending on the target source, you'll need to use different markdowns in text blocks.
| Target source | Link |
|---|---|
| SMTP Mail | HTML markup |
| The PDF markdown is limited by the tool's capabilities; it allows only simple text and tables. To create a table, you need to use a list of lists, where the first list represents the headers and all subsequent lists generate the rows. For example: [["Test name", "Duration (sec)", "Max threads", "Start time", "End time"],["name", "${current_duration}", "${current_vusers}", "${current_start_time}", "${current_end_time}"]] | |
| Atlassian Confluence | Confluence markup |
| Atlassian Jira | Jira markup |
| Azure Wiki | Azure markup |