Graphs
Graphs are used to specify which Grafana panels should be rendered.
How to add
- First, open the "Graphs" tab.
- Then click on "Add graph".
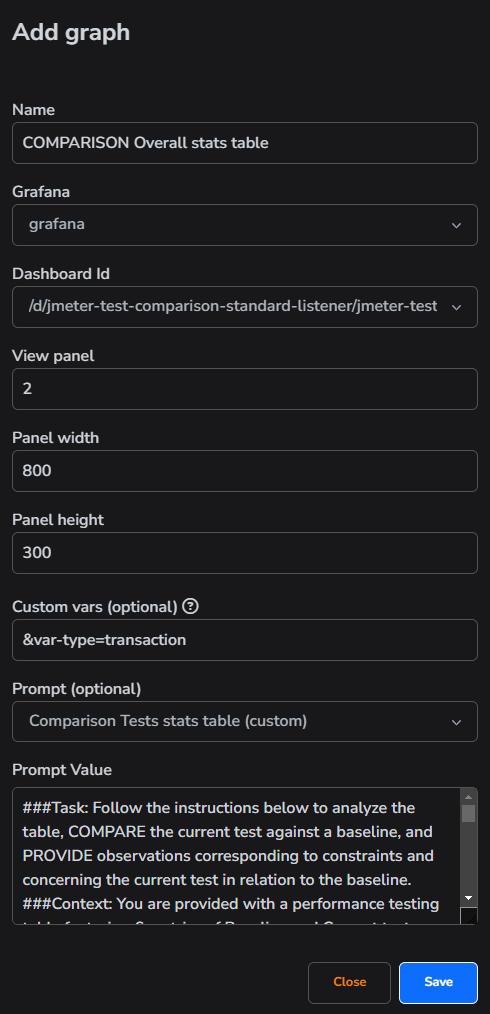
- Fill in all necessary fields.
- Click "Save" button.
info
The view panel is a unique identifier for each Grafana panel. To get this ID, simply open the panel in view mode and you can find the ID in the URL:
4is the View panel
info
You can add additional custom variables to draw graphs with these variables. For example, use the following format: &var-varname=varvalue